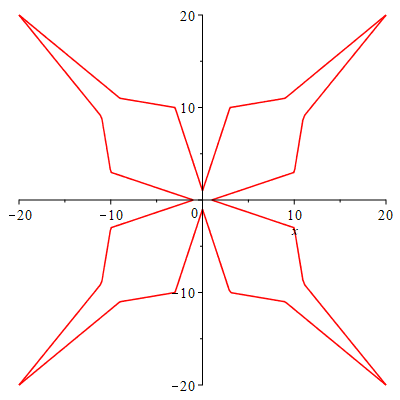
9. Use symmetry to plot the function and its inverse to create the following image:
>
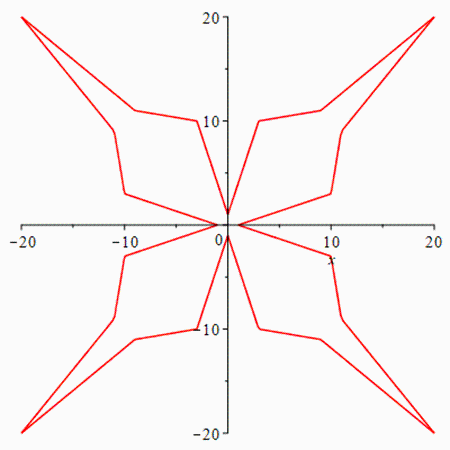
![plot([f(x), finv(x), `+`(`-`(f(x))), `+`(`-`(finv(x))), f(`+`(`-`(x))), `+`(`-`(f(`+`(`-`(x))))), finv(`+`(`-`(x))), `+`(`-`(finv(`+`(`-`(x)))))], x = -20 .. 20, color = red);](images/Maple 19 SVDiff Calc Workbook Solutions_375.gif)